


I’ve always been fascinated with the raw numbers relating to the operational status and growth of Bitcoin, especially as we ride the rollercoaster of the adoption life cycle. It’s why I created Statoshi.info in 2014 to track bitcoin metrics from the perspective of a full node.
To that same end, I’ve compiled statistical measurements of Bitcoin’s growth in 2019 from a variety of sources. It is difficult to see all of the moving pieces since the data is so distributed, but the picture becomes more clear when you bring them all together.
The one theme that I’ve taken away from all of these metrics is that 2019 was a quiet year for Bitcoin. Some metrics show continued pullback from the previous hype cycle while others are fairly flat, while some show modest growth. 2019 was a year of building; I expect the efforts expended in 2019 to yield results in the coming years.
Bitcoin is at the forefront of an increasingly complex ecosystem that continues to grow in a variety of ways. And for the 11th straight year, it stubbornly refused to die – though it would be premature to predict the death of Bitcoin obituaries!
General Interest
Relative search interest remains high in developing countries.
General interest in educational resources remained low.
As usual, exchange rate spikes tend to result in a feedback effect of inciting more interest.
Academic Interest
Academic interest continued to increase, which is great for the long-term prospects of this industry as we continue to gain a greater understanding of what we’re building.
Google Scholar articles published mentioning Bitcoin:
— Jameson Lopp (@lopp) December 23, 2019
2009: 83
2010: 136
2011: 218
2012: 424
2013: 868
2014: 2,070
2015: 2,820
2016: 3,380
2017: 6,460
2018: 11,500
2019: 13,700 (will ⬆️ due to listing lag)
Source: https://scholar.google.com/scholar?q=bitcoin&hl=en&as_sdt=1%2C34&as_vis=1&as_ylo=2019&as_yhi=2019
Funding and Forking
Venture capital funding was down 18% year over year – from what I’ve heard it’s mostly due to a cooling off on the “blockchain solves everything” hype.
Blockchain industry venture capital funding:
— Jameson Lopp (@lopp) December 23, 2019
2012: $2M
2013: $120M
2014: $368M
2015: $601M
2016: $597M
2017: $876M
2018: $3,127M
2019: $2,555M
Source: https://www.coindesk.com/bitcoin-venture-capital & Crunchbase.com
The red hot ICO market crashed by 85% year over year as many overfunded overhyped projects failed to deliver on their promises.
Although BTC’s exchange rate doubled over the course of the year, volatility was fairly low.
As we’ve seen several times over Bitcoin’s history, crashes cause flight from more speculative crypto assets to the relative “safe haven” of BTC, which results in the relative share of the market value going up. Bitcoin doubled in price during 2019 but many altcoins were either flat or in the red, increasing its “dominance” even further.
On-Chain Transactions
While development of Lightning Network made significant progress in 2019, which I’ll cover later on, due to its stronger privacy features we’ll always have more accurate statistics of on-chain activity.
A more controversial aspect of the changing nature of bitcoin is the transaction fees. Rising fees caused significant frustration for users trying to transact in smaller amounts of value during late 2017 and early 2018, but they have since fallen off a cliff due to a variety of factors. Lower transaction demand, improved fee estimation algorithms, adoption of segregated witness, transaction batching, and lightning network have resulted in more efficient use of block space and less contention for this scarce resource.
UTXO set growth went back to 2017 levels, reversing the downward trend seen in 2018.
Bitcoin Data Anchoring
While you may think of bitcoin as being a cryptocurrency, some users think of it as a trust anchor. By embedding data into Bitcoin’s blockchain, other systems can gain new properties such as tamper evidence and immutability.
The amount of outputs that embedded data into the blockchain increased at an unprecedented rate in 2019, mostly due to Veriblock’s “proof of proof” mining coming online. It will be interesting to see if this is sustainable during periods of higher demand for block space that cause transaction fees to rise significantly.
But OP_RETURN isn’t the only way to anchor other systems onto Bitcoin’s blockchain. Sidechains use pegging mechanisms to cryptographically lock BTC on the main chain and then allow users to unlock a proportional amount of tokens on a sidechain. This allows for experimentation with other features that are unlikely to be added to the Bitcoin protocol. At time of writing the only two production sidechains are RSK and Liquid.
The old Liquid stats site is no longer maintained but a new site should be running soon, at which point I’ll update this section with the relevant metrics.
Lightning Network
The network grew a ton in 2018 and then grew even more during the first half of 2019 before pulling back slightly. Though it’s also becoming more difficult to know how accurate the metrics are for Lightning Network as more channels are being created privately.
Network Security and Health
Network Security and Health
The number of reachable nodes didn’t fall much in comparison to the unreachable nodes — my suspicion is that people who run reachable nodes are highly dedicated to Bitcoin and/or using them for economic purposes, thus they are unlikely to turn off the node due to exchange rate volatility.
The sharper drop in unreachable nodes makes sense if many of these were newcomers to Bitcoin during the summer exchange rate spike, who had installed Bitcoin Core (on a home computer behind a router) to use as a wallet and then lost interest when the price fell.
A variety of improvements in block propagation have been implemented by Bitcoin Core over the past couple years and we appear to have leveled off on network propagation performance in 2019.
Given that the exchange rate doubled, it’s not surprising to see the hashrate more than double. Continued improvements in hardware efficiency also serve to lower the electricity required to achieve a given hashrate.
Cost of Node Operation
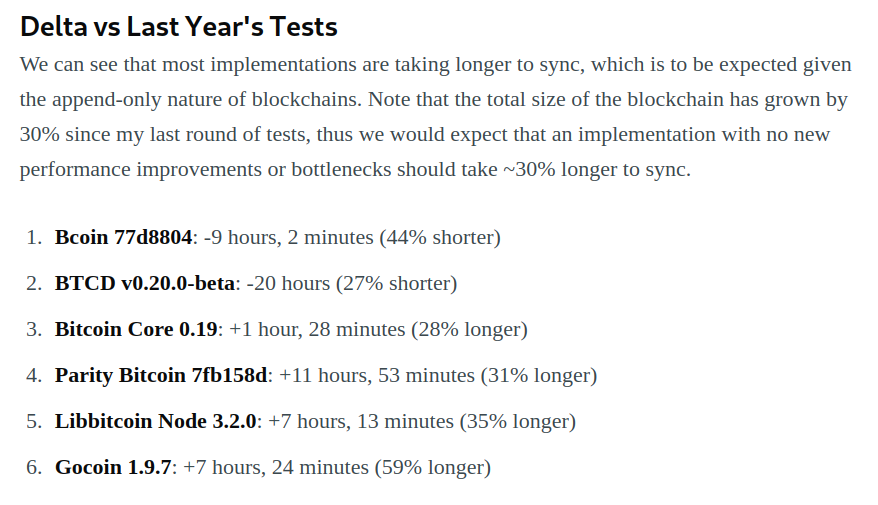
Anyone who has been following the Bitcoin space for long is likely aware of the scaling debate that resulted in a variety of both software forks and blockchain forks. The good news for node operators is that it appears the resources required to fully validate the entire history of the blockchain are decelerating, meaning that node operators should be able to take advantage of the deflationary nature of technology.
I ran performance tests of every Bitcoin client and sync time actually decreased or remained steady (linearly increasing along with the total blockchain size) for all but one client.
In terms of total storage required, the annual blockchain growth rate is now down to 20%, which ought to be easily addressed by increasing hard drive density. And of course you can always run a pruned node (though it will still have to download all of the data during the initial sync) that only needs 10 GB or so.
Bitcoin Economics
As usual, many of Bitcoin’s economic metrics were correlated to the exchange rate, which was fairly flat throughout the year.
Transaction volume in terms of BTC remained rather flat during 2019. This can also be seen in blockchain.com’s chart.
Conclusion
Most people are only familiar with the exchange rate of Bitcoin, if that. But exchange rate is just one of many metrics we can use to observe the evolution of this ecosystem. While any given metric can be gamed or may be taken from sources that aren’t 100% reliable, by using a diversity of metrics and sources we can get a rough idea of the trends in this space.
Bitcoin didn’t blow anyone’s expectations away in 2019; it made steady progress. Those of us who are dedicated to this system shall continue to BUIDL and add value; we have no control over the market but I expect that it will catch up to us sooner or later.
“Every day that goes by and Bitcoin hasn’t collapsed due to legal or technical problems, that brings new information to the market. It increases the chances of Bitcoin’s eventual success and justifies a higher price.” – Hal Finney


 year of progress")
