Preface
We live in interesting times. With the advances in technology and the proliferation of the internet — software is eating the world. Coming out of the Great Recession — the world had seen massive economic growth in what was close to an 11-year bull run largely dominated by U.S. tech equities.
We live in interesting times. With the advances in technology and the proliferation of the internet — software is eating the world. Coming out of the Great Recession — the world had seen massive economic growth in what was close to an 11-year bull run largely dominated by U.S. tech equities.
Along with that, wealth inequality was increasing, central banks across the world had been expanding their balance sheets and global debt was not set to recover from its unhealthy levels — it was growing.
Then came the Coronavirus pandemic.
“There are decades where nothing happens; and there are weeks where decades happen.”
Vladimir Lenin
That is precisely what it felt like — COVID massively propelled all the aforementioned trends, and more, into overdrive. Data from McKinsey has shown that digital adoption has been driven forward five years in the span of eight weeks.
With all of the economic trends being accelerated, the first set of lockdowns which shut down many businesses across the world and an upcoming second set of lockdowns, many economists fear that we are dangerously close to a global depression.
In such unprecedented and uncertain times, the simple act of protecting your wealth can be challenging.
In this article, we are going to explore some of the options investors have in protecting and growing wealth, the many recent events that changed the dynamics of investing and make the case for an underdog asset with the potential to yield large asymmetric rewards.
Cash Is Trash
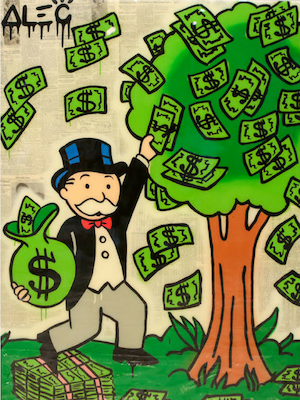
What our monetary supply looks like nowadays. Source: Alec Monopoly , “The Tree Of Life”
Why has money lost value?
In the old days, our monetary system had intrinsic value. It was directly linked to gold.
Post World War II, in 1944, the leading Western powers developed the Bretton Woods Agreement which formed a framework for global currency markets.
Every world currency was valued against the U.S. dollar, and the dollar, in turn, was convertible to gold at the fixed rate of $35 per ounce.
In the so-called gold standard, U.S. citizens could convert $35 at a bank for an ounce of gold. By 1976, this system had been completely abandoned — the tie between dollars and gold was cut entirely.
At that point, we firmly entered into the era of fiat money.
fiat (fi·at | \ ˈfē-ət) — an authoritative or arbitrary order : decree
fiat money — currency established as money by government regulation
Money was no longer backed by an inherently valuable asset (gold) — it was the trust of the government issuing it that stood behind the money and gave it value.
In an age where money is not tied to anything but the government backing it, said government is free to do whatever it pleases with it.
Such monetary policies are controlled by humans — meaning they are prone to greed and error. History has shown that this often leads to governments devaluing their currencies, most often through inflation.
Inflation is cruel, and complex. When the government introduces more money into the system, it eventually trickles down into the economy. At that point, the people who held cash lost part of their purchasing power.
That’s to be expected, after all. If demand is the same, the price of goods and services is generally proportional to the monetary supply in an economy. That is, if you have $100 and 100 apples in an isolated system, one apple would be worth $1. If you are to double the dollars to $200 and nothing else changes, one apple would logically become worth $2.
From the perspective of a single person, this effect isn’t as obvious. If you had $1 at one point, you believed you had enough to buy one apple. But gradually, apple prices rise to $2 and you get left behind. This is because new money in the system does not spread evenly.
If you were to hold your dollar throughout the rise, you would have lost 50 percent of your purchasing power.
A peculiar thing can be observed in markets:
Denominated in gold, the S&P 500 had the same price in February 2007 as it did in November 2019, despite the respective nominal prices in dollars being $1,444 and $3,176.

S&P 500 to Gold Ratio Chart. The number tells you how many ounces of gold are required to buy the S&P 500.
If you were to sell a share of the S&P 500 in 2007 for $1,444 and held it until November 2019, you would not be able to buy the same share of the S&P anymore — only half. Conversely, if you were to sell a share of the S&P 500 for 2.12 ounces of gold at that time, in November 2019 you could have rebought that S&P share.
Again, if you were to hold your dollar throughout the rise, you would have lost 50 percent of your purchasing power.
While demand and market narrative certainly play a role, a driving cause is the increase of money in the system. For the S&P 500 to grow 100 percent and keep the same price in ounces of gold, it would mean that the price of gold must have risen at the same rate.
While it recently has been the subject of market manipulation, gold’s price rises with inflation in the long term.To help drive the point — look at the monetary supply of U.S. dollars. It has more than doubled from February 2007 to November 2019, just like gold and the S&P 500’s price.

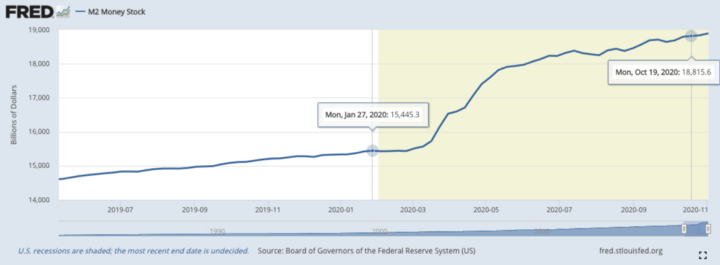
M2 Money Stock. Source: https://fred.stlouisfed.org/series/M2
M2 is a measure of the U.S. money supply that includes cash, checking deposits, savings deposits, money market securities, mutual funds and things like certificates of deposit, some of which are valued at under $100,000. It is a closely watched inflation indicator. As with most things in our complex economy, it can be increased due to numerous factors.
This has a lot to do with money printing — a trend that helped get us out of the last recession, lower unemployment to its lowest mark in history and helped fuel this historical bull market.
This trend was also greatly accelerated by the virus.
Post-COVID Monetary Supply
During the initial COVID-19 shock and lockdowns, the stock market saw its fastest fall in history and the most devastating crash since the Wall Street Crash of 1929 — the so-called “Coronavirus Crash.”
This shock put the central banks and governments in a dicey position — they were forced to provide monetary stimulus in order to both stabilize the markets and provide relief to the unemployed, low-income families and small businesses.
And so they did — the U.S. passed a $2.2 trillion stimulus package, most notably going toward:
- $600 extra per week going to the unemployed
- $1,200 checks sent to every American earning less than $99,000/yr
- A controversial $500 billion in loans to large corporations
- $377 billion in zero-interest loans for small businesses that can be forgiven
The progress of the stimulus can be tracked via https://www.covidmoneytracker.org.
The rest of the world also printed massive amounts — e.g., Europe approved a €750 billion purchase program.
It’s worth taking a moment to pause and digest how large these numbers are.
One trillion is 1 million million — 1,000,000,000,000, or one thousand billions ($1,000 billion).
This is large both in absolute and in relative terms — our monetary supply was close to $15.5 trillion before COVID. This is most evident in the sudden rise of the U.S. monetary supply:
In essence, we saw the M2 Money Stock increase by more than $3,000 billion (20 percent) in six months (March to September 2020) as much as it did in the previous four years, from 2016 to 2020.
This was because in six months, the Federal Reserve printed more money than it did during the decade after the 2008 financial crisis.
- On January 1, 2009, it had $2.12 trillion on its balance sheet
- It started 2020 with $4.17 trillion
- By June 2020, its balance sheet was at $7.16 trillion
Fed Actions
Central banks typically have two main levers they can pull in order to speed up the economy — they can lower interest rates and they can print money (quantitative easing).
The shock from COVID put the central banks in a dicey position — they were forced to provide monetary stimulus in order to stabilize the markets.
To start with, they lowered the U.S. interest rate to an all-time low target of 0 to 0.25 percent in March.
The world mostly followed — Australia and the Bank of England have both cut their rates down to a record low of 0.1 percent. Some others banks, like the European Central Bank and Bank of Japan, already had negative rates.
Technically, the Bank of England also dipped its toes into negative territory in May.
It seems like the whole world is a feather away from negative rates, a highly-debated and controversial topic.
Finally, it’s worth mentioning that the Fed foresees such rates until at least 2023. A representative has recently been quoted as saying that “they’re not even thinking about thinking about raising rates.”
When the Federal Reserve raises the federal funds rate, newly offered government securities (treasury bills and bonds, widely regarded as the safest investment) usually experience an increase in returns.
In other words, the risk-free rate of return goes up, making these investments more desirable.
Conversely, if rates fall — the risk-free rate decreases.
Additionally, interest rates have an inverse correlation to bond prices, so the more rates fall, the more expensive bonds become and therefore the less they yield.
Both of these incentivize income-oriented investors seeking higher returns to flock to riskier bets.
During the pandemic, the Fed also started buying corporate bonds. Additionally, it also abolished the fractional reserve requirements of banks, a key factor in fractional reserve banking.
Instead, it has shifted to an ample-reserves system, in which the Fed pays member banks interest on reserves that they keep in excess of the required amount.
This all goes to show that we are living through a period of unprecedented monetary policy. If anything, this novelty will likely continue as the International Monetary Fund is urgently calling for a reform of global debt and even asking for a new Bretton Woods-style agreement.
Monetary Supply Outlook
The current flurry of printing is not likely to stop anytime soon.
As of writing (just seven months after the last stimulus) the U.S. is currently negotiating a new package and Europe just hinted at a new package come December. After all, COVID is not over and winter is coming — we may be in for the largest infectious wave yet.
Back in March, the Fed was quick to assure us that it had an infinite amount of cash and that they were ready to do whatever it takes to ensure banks have enough capital.
"There is An Infinite Amount Of Cash At The Federal Reserve. We Will Do Whatever We Need To Make Sure There Is Enough Cash In The Banking System." – Neel Kashkari (Federal Reserve Bank): >>Translation<<: We Are Going To Obliterate The Purchasing Power Of Your Currency. pic.twitter.com/qaMFfOI70b
— Ben Rickert (@Ben__Rickert) March 23, 2020
For decades, part of the Fed’s job was to keep inflation at reasonable levels.
In August it changed its policy to instead prioritize maximum employment. They’re saying they will prioritize low unemployment rather than low inflation. This is a historic shift and profoundly consequential.
Consequential not only for the US.., but also for all of the other central banks in the world that largely follow the Fed. It opened the door for high future inflation throughout the world.
All signs are pointing to the fact that the Fed will act as a constant guardian against unemployment and, therefore, recessions.
If anything, with the rise of market fragility (as we discuss later) some people are predicting that the Fed will have to resort to buying stocks in the future. That’s not far off, especially when it recently started buying corporate bonds and elected officials from the Fed indirectly admit that they are unlikely to be able to stop manipulating the market. By all accounts, it seems like the Fed is trapped — the market is so fragile that the smallest of chips could trigger an avalanche of economic devastation.
Such monetary policies and market interventions carry risk with themselves.
Recency bias tells us that high inflation is unlikely, but an investor only needs to go back to 1980 when the U.S. had an official inflation rate of 10 to 14 percent.
The low inflation rates of today can be explained with the fact that technology is such a massive deflationary force that it’s combating the inflation to reasonable rates.
If you expect an annual 2 percent inflation, which is what most governments target, then the value of your money is halved over 35 years due to the power of compounding.
It is arguable whether these numbers will continue to hold given the policy shift, the 2020 explosion in stimulus and likely continuation into 2021. There is also a separate argument to be made about whether the 2 percent inflation number is accurate at all and whether everybody experiences inflation the same way.
By all accounts, the last couple of decades have shown that holding cash yields no long-term benefits.
The only attractive use case for cash is to take advantage of short-term opportunities — something that is hard to time correctly and unlikely to be done by non-professionals.
If cash is trash, and all the facts are pointing that it’s going to continue to be so for the foreseeable future, then any astute investor would try to move their capital outside of cash and into assets.
In other words: don’t sit on cash!

This should not be you. Source: Alec Monopoly , “ The Boss”
Assets
Now that an investor is forced to preserve his wealth in assets, the question becomes which assets are the best to pick?
There are many and a lot can be written about the topic, but for purposes of brevity we will go over two very popular ones — stocks and bonds.
Equities
One very common and lucrative asset is company stock.
Economists love and hail shares because they are considered a productive asset — it is something that is working daily to increase its value.
The opportunity and the productivity is partly why the global stock market today is worth close to $100 trillion — a roughly 100 percent increase from 10 years ago (remember how big a trillion was?).
Unfortunately, we are at a very wobbly place in the markets. There is an extremely wide dispersion of revenue multiples between the highest and lowest valuation stocks. The spread ranks in the ninety-third percentile since 1980.

Dangerously Close To Bubble Territory
A growing concern among many is the likelihood that the stock market is in a bubble right now. It’s worth referring to Investopedia’s definition of a market bubble:
A bubble is an economic cycle that is characterized by the rapid escalation of market value, particularly in the price of assets. This fast inflation is followed by a quick decrease in value, or a contraction, that is sometimes referred to as a “crash” or a “bubble burst.”
Typically, a bubble is created by a surge in asset prices that is driven by exuberant market behavior. During a bubble, assets typically trade at a price, or within a price range, that greatly exceeds the asset’s intrinsic value (the price does not align with the fundamentals of the asset).
This definition is not far off from what we’ve seen so far in 2020. There have certainly been some stocks that have exploded in growth, whose price has greatly exceeded their intrinsic value.
More concretely, we’ve seen some record large price-to-earning (P/E) ratios, mostly in tech stocks, although all growth stocks have been benefitting.
The market has somewhat normalized overvaluing high-growth stocks with many times the actual money they bring in — this is in the hopes that they are positioned to grow and dominate their industry.
Some analysts see these valuations at dot-com bubble levels and are rightfully reluctant to chase the rally.
For example, tech stock P/E ratios were considered in the “normal” range at around 30 — already twice the 15 P/E historical average of the S&P 500.
A large number indeed, but one that has been blown out of the water given some recent highs. We will now go over a selection of popular big-name stocks with absurd P/E ratios:
- Zoom at one point reached a P/E ratio of 1,790!
- Tesla is at a P/E ratio of 1,019

Tesla — 1,019 P/E. For comparison, aggregate automotive industry P/E is 14. Source: macrotrends.net.
- Zoom later settled at a P/E ratio of 647

Zoom — 647 P/E. Source: macrotrends.net.
- AMD at a P/E ratio of 153
- Etsy at 117.
- NVIDIA at a recent high of 100.

NVIDIA — 100 P/E. Source: macrotrends.net.
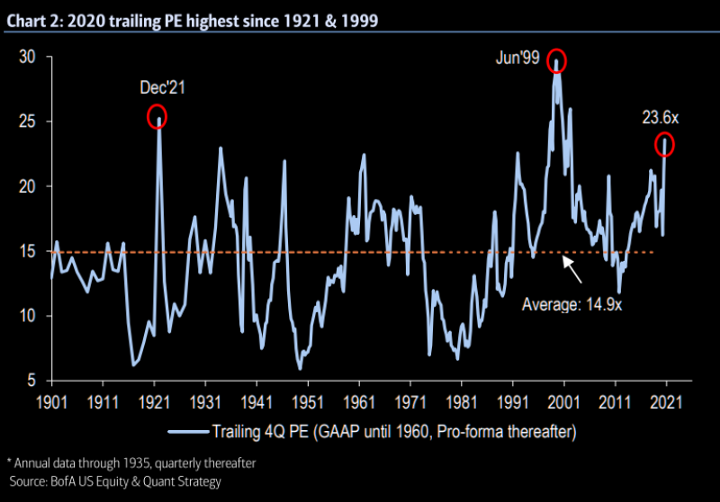
While we’re not meant to cherry-pick stocks, it seems like most companies are at recent P/E ratio highs. The whole market’s P/E ratio is the highest it’s been since 1999.
But wait, there’s more!
Because unprofitable companies can’t have a P/E ratio (no earnings), we will look at their valuation compared to their TTM Revenue — the so-called “Price–Sales” ratio (P/S).
It is generally expected that P/S ratios are lower than P/E ratios, since they are measured for a company that is not even profitable yet.
Freshly after going public in June, Nikola was off the charts, reaching a P/S ratio of 66,000 (!!!) at a $29 billion market cap, with only $0.44 million in revenue.

NIKOLA stock price. Source: macrotrends.net.
Later, a short seller exposed it to be a fraud — something that even got the U.S. government investigating the company. As of this writing, this stock was still trading at a 19,000 P/S ratio.
We continue with our roundup of questionably valued stocks:
- DraftKings at a 195 P/S ratio
- Snowflake — a recent hit IPO, dubbed by some as the biggest software IPO in history, at a P/S of 184. This is four-times comparable enterprise tech stocks
- Datadog at a 65 P/S ratio
- Shopify, fueled by a 230 percent rally in the last year, is at a 60 P/S ratio
- Cloudflare at a 48 P/S ratio
- Okta, a recent IPO, is at a 40 P/S ratio
- Twilio at 32 P/S ratio
While these numbers certainly pale in comparison with Nikola’s astronomical bubble, it is worth remembering that P/S ratios are a worse indicator than P/E, because the companies are not even profitable yet.
Some experts consider a P/S larger than four as unfavorable.
Take a moment to breathe and digest the numbers presented here, perhaps by going over the section again. These are historical numbers that have been normalized by recent market speculation.

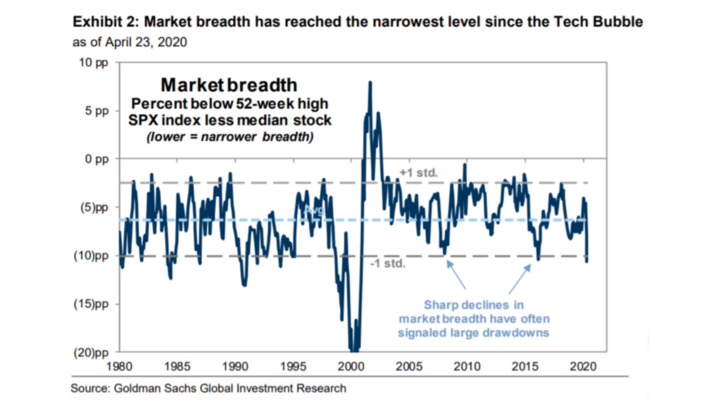
This has resulted in a large dispersion and narrower breadth in the markets. That is, a relatively small group of stocks are driving the upside in the market.
This has resulted in a large dispersion and narrower breadth in the markets. That is, a relatively small group of stocks are driving the upside in the market.
Often, narrow rallies lead to large drawdowns as the handful of market leaders have a high chance of failing to generate enough fundamental earnings strength to justify the elevated valuations and investor crowding for long.
Historically, sharply narrowing breadth has signaled below-average S&P 500 returns as well as larger-than-average prospective drawdowns.
Regardless, some people are resourceful and are making use of the situation. A record number of companies are IPOing in 2020.
As of this writing, there have been 365 IPOs on the U.S. stock market this year. That is 73 percent more than at the same time in 2019.
Others are taking advantage of their pricy stock in order to acquire smaller companies.
A random thought about the markets right now:
— Chamath Palihapitiya (@chamath) October 20, 2020
1. Markets like this can separate the most ambitious CEOs from everyone else.
2. Unless you found a network effect, or your product creates a natural ecosystem, your growth is generally a function of organic AND inorganic growth.
The Market Is Open To Newbies
There are multiple theories as to what is causing this price distortion — one of them is the recent influx of retail investors into the market.
During the pandemic, the daily trading activity and number of new signups for online brokerages has more than doubled. A lot of brokerages had trouble keeping up with the traffic.
Robinhood, for example, gained 3 million customers from the January to May period and is predicted to have added at least 5 million year-to-date. This would be 50 percent user growth on top of its already-large 10 million user base.
Many people apparently found themselves day trading in their homes as a means to pass the time. That is reasonable, given the zero commissions on trades, the $1,200 government checks sent to people, the beefed up unemployment benefits, massive volatility in the stock market that is likely to attract people and the fact that other venues for gambling like sports betting were closed.
Look no further than Dave Portnoy, who rose to Twitter fame livestreaming his day-trading activities, gaining 700,000 followers since the start of the year.
Say it you cowards. Stocks only go up. Stocks only go up. Say the words Ron. I am your King. #DDTG pic.twitter.com/ufyXV0RZxp
— Dave Portnoy (@stoolpresidente) July 6, 2020
I’m being modest when I say I’m the world’s greatest day trader. My unlimited money has upgraded to infinity money. #DDTG pic.twitter.com/QJ0Dakp5zU
— Dave Portnoy (@stoolpresidente) June 5, 2020
Other online communities have also grown massively. Reddit’s /r/wallstreetbets subreddit has gained 800,000 followers, doubling to 1.6 million year-to-date.
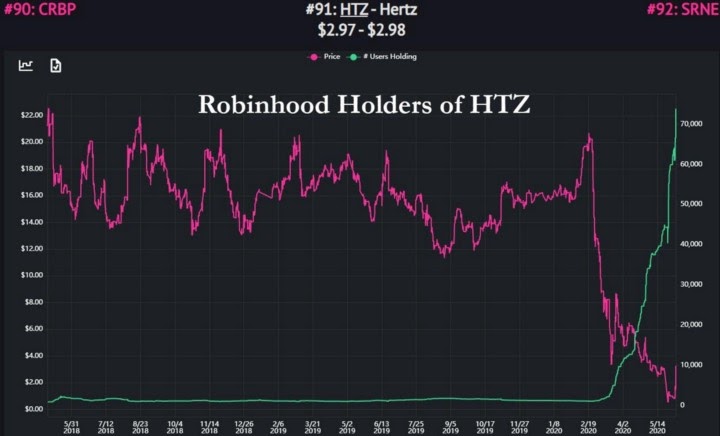
This horde of new investors can explain the questionable movements in the market, like zombie firm Hertz’s stock soaring after bankruptcy.
Source: Robinhood
Hertz made use of the situation and got approval to sell an additional $1 billion in stock even though it itself warned that the shares are likely to be worth nothing.
Similar things happened to companies like Chesapeake, which filed for bankruptcy, owing $9 billion, but saw a spike in new user positions due to its price rising because of a 1-to-200 reverse stock split.

Chesapeake Energy holdings. Source: Robintrack.
If it were not for the stock split, shares are predicted to have been worth around 8 cents.
It is intriguing to see what effect these stock splits have on the market’s perception of a stock.
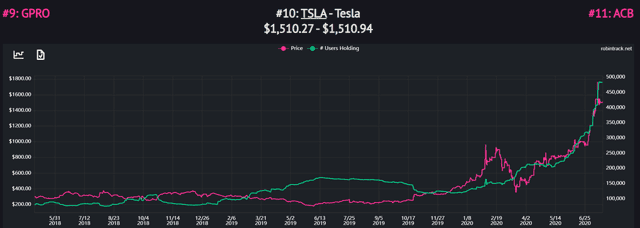
Tesla also did a normal 1-to-5 stock split at the end of August after its stock has been skyrocketing all year, for no reason, reaching the massively inflated 1,019 P/E ratio we alluded to earlier.
Source: Robintrack
Perhaps the split had an effect, because Tesla subsequently saw a record amount of trading in September.
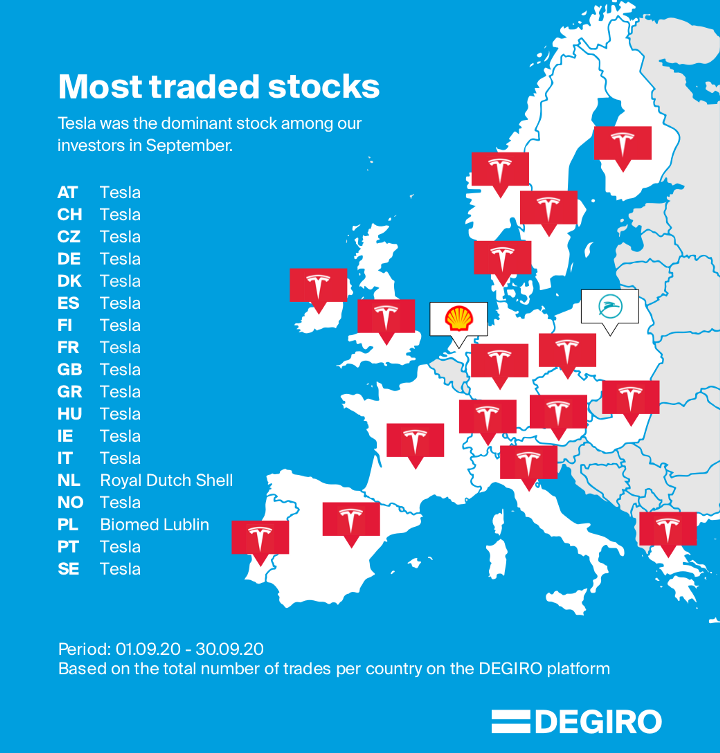
European Stock Broker Degiro showing record trading data for Tesla in September
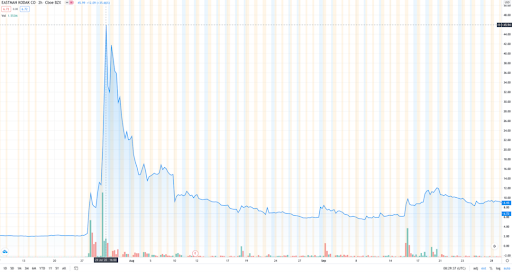
To best end this section, let us explore failing company Kodak, whose stock soared as much as 2,189 percent (!) in two days after the company announced it received a government loan to make drug ingredients to help with the pandemic.
Retail traders piled onto the stock in just a couple of days, driving it up.
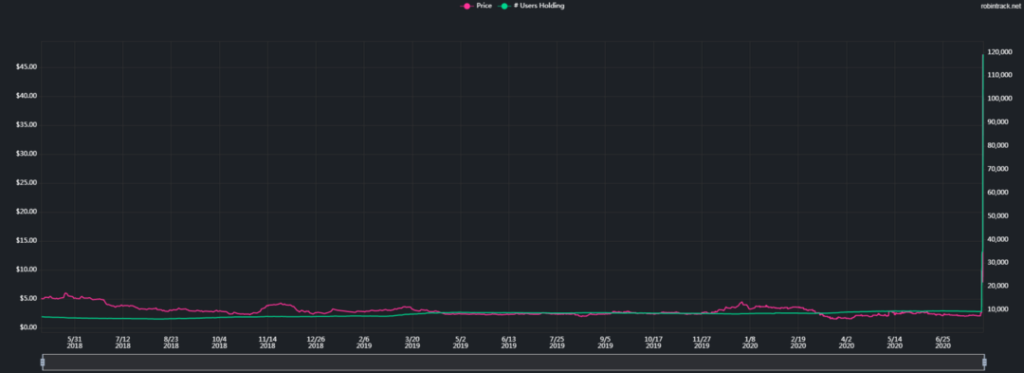
Number of Robinhood users holding KODAK. Source: Robintrack.
Unfortunately, they got wiped out in record time as well.
It is hard to deny that retail investors have a role in some of these irrational rallies.
Bloomberg analysis says individual investors account for 20 percent of daily volume.
Such widespread speculation is likely to cause volatility in the market given that these speculators are quicker to enter and exit stocks than the average person.
It is theorized that these investors have an outsized impact because online brokerages like Robinhood are selling their order data in real-time to hedge funds like Citadel, which are leveraging high-frequency trading bots to front-run the retail investors, amplifying their impact on price in the process.
In any case, these extreme examples showcase that there is a decent amount of irrationality in the markets today, likely spread out to most stocks.
That being said, some people are realizing the ludicrousness in the market.
Tesla stock price is too high imo
— Elon Musk (@elonmusk) May 1, 2020
You know you’re in a weird market when CEOs publicly admit that their companies are overvalued.
Bonds
We’ve concluded that the stock market is at unprecedented levels right now and therefore risky — it would be prudent for us to find something safer.
Bonds have traditionally been considered a safe bet — an incredibly popular portfolio allocation has been the so-called Classic 60/40 split — 60 percent in stocks and 40 percent in bonds, the idea being that the latter hedges your risk in stocks.
In today’s rapidly changing environment, people are beginning to question whether this portfolio strategy is as effective as it has been before.
Remember that bond prices are inversely correlated to interest rates and the Fed recently announced that those are likely to stay at 0 percent until 2023. The result should be high bond prices and low yields from them.
Given that bonds (and stocks) are at historically high valuations, the future is understandably projecting underperformance in said assets.
Bond yields today are so low that small changes (e.g., inflation) could lead to losses.
Worse off, bond defaults are spreading amidst the pandemic. As bankruptcy filings are surging due to the economic fallout of COVID, many lenders are not recouping as much as expected from bond defaults.
When a company defaults, an auctioned sell-off of all its assets occurs. The proceeds go to the bond holders. Typically the norm has been to recoup close to 40 cents on each dollar invested in a bond that has defaulted.
Today some are seeing 1 to 4 cents recouped for every dollar — a 99 percent loss in some cases.
Debt issued by the owner of Men’s Wearhouse (August 3) traded for less than 2 cents on the dollar. When J.C. Penney Co. went bankrupt (May 15), an auction held for holders of default protection found the retailer’s lowest-priced debt was worth just 0.125 cents on the dollar.
It shouldn’t have been a surprise — people were calling these zombie companies out a long time ago:
“I’m in Awe of How Long Zombies Like J.C. Penney Keep Getting New Money to Burn. But Bankruptcy…”
Truth be told, the bond market has been rotting from the inside. The long-lasting repercussions of ultra-low interest rates enabling risky companies to sell bonds with fewer safeguards (covenants).
Before any hint of a downturn, there were concerns in the increase of borrower-friendly covenants of bonds. Money managers had tight deadlines with insufficient time to sift through reams of loan documentation and this allowed them to miss loopholes in fine prints.
Desperate to generate higher returns during a decade of rock-bottom interest rates, money managers bargained away legal protections, accepted ever-widening loopholes, and turned a blind eye to questionable earnings projections.
Corporations, for their part, took full advantage and gorged on astronomical amounts of debt that many now cannot repay or refinance.
Creditors always do worse in economic downturns, but in previous downturns, they had more power to press companies into bankruptcy sooner in order to stem losses.
Essentially, the effect of this is that once corporations get to bankruptcy, they’ve exhausted their options for fixing their debt, often topping up even more to try and get them through the pandemic.
It is amazing to learn about the loopholes such companies jump through to sustain themselves. For instance, they can execute asset transfers, spinoffs, carve outs and other controversial moves as a result of allowances inserted into the fine print of loan documents whose reviewers often do not have enough time to understand, as we said earlier, e.g.:
- Retailer J. Crew Group Inc transferred its intellectual property outside of creditors’ reach as part of a debt restructuring (prompting a legal fight with the lenders)
- PetSmart Inc transferred part of its stake in online unit Chewy.com away from lenders as it struggled to turn around its brick-and-mortar business. Again prompting a legal fight, some dropped their litigation after reaching a deal
Most details buried in loan documents rarely come into play for companies with healthy balance sheets, but a turn in the credit cycle as we’re seeing now could leave businesses struggling to repay lenders and their private equity owners scrambling to protect their investments from creditors.
The Fed’s announcement that it will buy corporate bonds in the midst of the recession boosted trading in said bonds and lowered the interest rates in that market. This made it more favorable for companies to take on more debt — and so they did.
This lowering of interest rates also pushed investors toward riskier higher-yielding securities which allowed junk-rated firms to borrow more in order to help them survive the crisis. Funny enough, that increased demand has also lowered interest rates in the junk bond market.
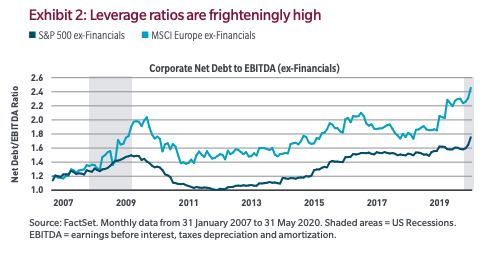
The high demand has resulted in a massive increase of debt. The Net Debt-to-EBITDA ratios of companies is at a recent all time high.
The dynamic here is twofold — companies take on more debt and investors get a lower rate of return for the same (or greater) risk.
Respectively, because corporate America is overburdened with debt, companies will have to divert more cash to repay these obligations, which places a limit on the amount they can spend on growing, especially if profits are dwindling.
And because investors get a lower rate of return for arguably greater risk, they are incentivized to pursue other ways of protecting their wealth.
Risk Of A Recession
It’s easy to get lost in the day-to-day market swings and forget the big picture. Let me remind you that we are at our most leveraged and risky market in the last decade, coupled with numerous other unfavorable circumstances.
Many recession signals are flashing red nowadays and have been for awhile.
After all, we had many months of business closures and lockdowns that not only cut revenue down to nearly 100 percent for some businesses, but also likely changed consumer spending habits permanently.
These closures and changed spending habits have hit small businesses the hardest. Note that small businesses employ about 50 percent of the U.S. workforce.
Yelp data shows that 60 percent of U.S. business closures due to the pandemic are now permanent. That is to be expected — you can’t cut off a low-margin restaurant business’ revenue for long and at reopening have it operate at a forced 50 percent capacity due to distancing requirements. This totally throws off their cost model.
It’s worth noting that a similar thing is happening in Europe as well — half of the small- and medium-sized businesses there face bankruptcy in the next year unless revenues pick up. The survey that indicated this was conducted in Europe’s five largest economies in August, before the second wave of COVID-19 started ramping up. With some countries reimposing stricter measures to mitigate virus spread, this is likely going to further squeeze already-suffering businesses.
Unprecedented Unemployment
During the pandemic, we saw an all-time high record of unemployment filings. People were being fired left-and-right!
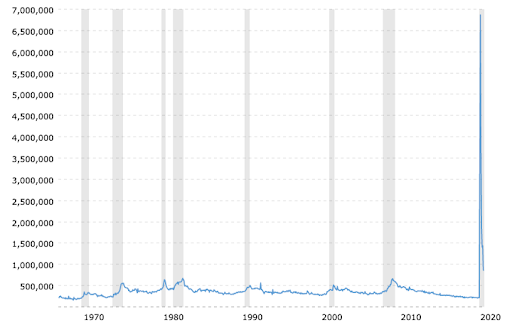
Unemployment claims per Month. Source: https://www.macrotrends.net/1365/jobless-claims-historical-chart
Prior to COVID-19, the U.S. had a record of 695,000 weekly unemployment filings, recorded in 1982. This year, it obliterated the record. The new record is now 6.8 million unemployment filings in a week.
Worse off, in the last 37 weeks since the start of the pandemic, weekly unemployment filings have not gone below this previous all-time high record.
As of this writing on November 13, the weekly unemployment filings are at 709,000 and have not shown signs of stopping. This is a very bad sign.
This is perhaps why the U.S. had beefed up unemployment benefits with $600 extra per week. Funnily, some people were making more while unemployed than while holding a job. It is likely that this helped fuel consumer spending throughout the quarter. Unfortunately, this stimulus ended in August and a new one is not in sight yet.
Many Americans are living paycheck-to-paycheck. Report conducted before the pandemic by Bankrate concluded that:
- 59 percent of Americans do not have enough savings to cover a $1,000 emergency expense — they would need to take credit
- 28 percent of Americans more higher credit card debt than savings
- Younger people, the ones who staffed the now-decimated hospitality industry, are more likely to have a higher rate of credit card debt than savings.
Barring government intervention, it is unclear how these unemployed people will pay back debt they owe, not to mention survive.
Unprecedented Problem
The previous financial crisis began with a much more focused set of problematic companies, something which bailouts and structural fixes could alleviate more easily.
This crisis, though, is much greater in breadth. Many more industries are affected, including so many small businesses, as we mentioned.
This is much harder to fix, especially when the Fed is out of bullets. Interest rates are at zero, its last tool is to print more money.
But to have this money make it to the businesses that need it most, banks need to be ready to lend it. Recent statistics shows that this is not the case — banks are tightening credit standards at record rates in both C&I and consumer loans. This is at the same time that demand for credit has dried up.
Consumer debt continues to grow, too. The more indebted the average person is, the less likely they are to take on more. Rather, they’d be more reluctant to spend and instead save in order to pay back their dues.
Given that a major part of the economy is fueled by consumer spending (a lot of which is based on credit), a slowdown can be expected.
Unprecedented Fragility
Above the immediate conspicuous concerns lie others that are better hidden. One of them is the fragility of the market — a subtle risk that is likely largely unaccounted for by many investors.
Fragility In Carry Trading
Oversimplified, a carry trade is essentially one where you make money if things do not change.

A picture is worth a lot of words. Source: The Wall Street Journal
Carry trades first started in the currency markets but have spread more widely into the equity markets. A debt-financed corporate share buyback is a good example of an equity market carry trade — issue cheap debt and buy back your own equity at a higher yield.
For example, the big four U.S. airlines bought back $42 billion of their own stock over the last six years, while increasing their debt by 78 percent. CEOs pocketed $430 million extra from this move, but the companies had no financial cushions and had to be rescued by the government. Worse, they recently said that they need more.
There are both more direct ways we see carry trades take place (volatility trading in hedge funds) and more sophisticated ways. At their core, all of these trades are vulnerable to volatility.
Carry trading amplifies market fragility and hides unrevealed risk — such trades always increase both leverage and liquidity.
The growth in leverage makes the world more fragile, but increased liquidity temporarily hides this fragility.
As the amount of carry trading increases, it makes the system appear more stable than it is since there’s more liquidity in there and less volatility.
Carry trading is very vulnerable to volatility, though. Because carry traders are also very leveraged, their trades become extraordinarily sensitive. They cannot withstand a modest amount of losses.
This problem has got bigger over time. Because the market is made up of more carry trading and therefore is more sensitive to volatility, the Fed is forced to react to shorter-term market developments, almost babysitting the market.
Because of this, some people have made predictions that the Fed is going to have to buy stocks directly at some point. It sounds bizarre but at the same time, makes sense.
That’s not all, though — there are other hidden fragilities in the markets.
Fragility In Leveraged Lending
Back in 2019, the Fed was warning that leveraged lending was running rampant and could exacerbate a downturn.
Leveraged loan — a type of loan extended to a company/individual that already has considerable amounts of debt.
A large percentage of loans had gone to companies with a debt-to-earnings ratio of six to one. We call these “zombie firms” — unprofitable firms which stay solvent merely because they take advantage of low-cost borrowing. Such firms don’t make enough to cover their interest but survive by refinancing their debts.
Further, the COVID-induced tightening of lending standards and the massive downgrades of leveraged loan ratings saw a 68 percent drop in leveraged lending issuance — from $271 billion in Q1 to $113 billion in Q2:
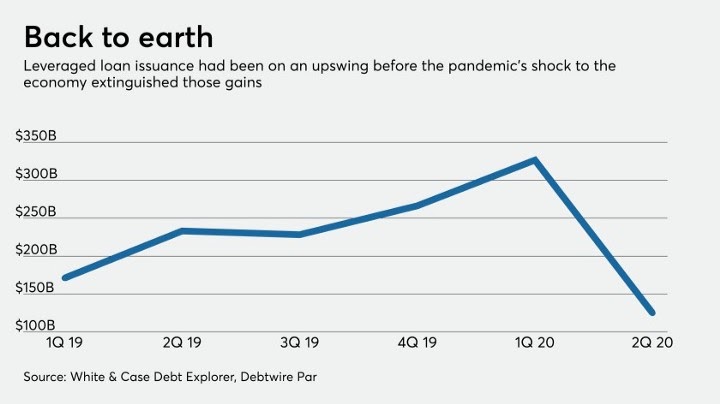
A large amount of loan downgrades is never a good thing. The following doom loop exists:
- State pension funds, the largest buyer of corporate bonds, can no longer buy bonds that are downgraded (they are required, by law, to buy investment-grade bonds)
- Said corporate bonds go to the junk bond market whose volume will likely not be enough to fuel them
- If the corporations can’t issue bonds, they can’t keep up the stock buyback frenzy
- If no stock buybacks, the largest buyers of said equities leaves the stock market — prices could crash
It is likely that this doom loop is what made the Fed start buying corporate bonds.
Default rates on leveraged loans have not hit highs yet (just 4 percent, up from 1 percent a year ago), but are possible to follow. It is reasonable to assume that you cannot get a market dependent on easy, leveraged loans and expect all to be fine when you cut off the supply.
Government Instability
To add fuel to the fire, the U.S. is in shambles. It is arguably the most divided it’s ever been since the Civil War in the mid-19th century.
The foundation on which the immense wealth and power of the U.S. is built — the society — is fundamentally shifting.
The U.S. was unable to elect a president for more than five days. Even now that the media has reported that Biden has won, there have been massive accusations of voter fraud and fake news. This is only stirring up fire in an already-heated country.
It is very hard for a government to maintain good policies when under severe scrutiny from the opposite political party and supporters.
To top it off, hundreds of thousands of COVID-19 cases are coming in by the week there.
COVID-19’s Second Wave
As this article is being written, the second wave of COVID-19 is spreading throughout the world.
Europe is increasing measures and implementing lockdowns in some countries and the virus spread uncontrollably in the U.S. while it was busy with elections.
Nearly every U.S. state is now classified as having “uncontrolled spread” of COVID-19, according to https://t.co/dKkpVrDiq1 pic.twitter.com/5VFKsN5aSV
— BNO Newsroom (@BNODesk) November 11, 2020
A second, larger wave may mean more lockdowns that hurt businesses.
Other Trends
On top of all, there are other trends that should also have a noticeable impact on the market.
The U.S. may be in a retirement crisis, as a large number of Baby Boomers are set to retire. Due to a lack of planning, the 2008 financial crisis and chronic low interest rates, a lot of them lack the necessary savings to retire. COVID-19 has only added to this shortfall.
COVID-19 is set to cause a lot more capital to shift hands. As commercial real estate leases expire, many companies are set to not renew as they’ve moved to a fully remote culture after realizing the benefits. Combine this with people moving out of large cities and you can see low demand in the future.
Such low demand is likely to cause additional toil on the already-struggling local service businesses that are close to bankruptcy.
Summary
In conclusion, we have record-high factors that are paving the way toward a bad economic future. Many people were expecting a recession before the pandemic, too.
It is indisputable that the risk of a recession today is many times higher than it was a couple of years ago, as evidenced by:
- Overpriced equities expecting high growth (record high P/E ratios)
- Companies overburdened with debt
- Small businesses closing permanently at a record pace
- Unemployment at high levels
- Consumer debt at high levels
- U.S. government instability
Additionally, one of the safest havens — the dollar — is likely to depreciate at a record rate due to the unprecedented amount of printing.
Similar to shoe shine boys giving stock market advice in 1929 and acting as an indicator for Joseph Kennedy to exit his long positions, today we see porn star influencers pitching trading classes.
It is hard to refrain from investing when you’re seeing people make money easily by just putting it into the top-four tech companies, but history has rewarded the prudent and patient.
“Being positioned to make investments in an uncrowded arena conveys vast advantages. Participating in a field that everyone’s throwing money at is a formula for disaster.”
Howard Marcs
In all regards, many economists are pitching for a switch to alternative, “riskier” assets. Many such assets exist — foreign equities, private equities, inflation-linked bonds, emerging market assets and more.
We will now focus on the ultimate alternative asset of them all.

A Succinct Introduction To Bitcoin
Bitcoin is the first blockchain-based cryptocurrency. It was invented in 2008 by an individual or group known by the pseudonym Satoshi Nakamoto and was released as open-source software in 2009.
Bitcoin is a scarce global decentralized digital asset — a type of financial instrument backed by the internet. It is an open network in which anybody can participate. Most importantly, it has a disinflationary nature by having a fixed cap on supply.
Bitcoin falls into an entirely different category of goods, known as monetary goods, whose value is set game-theoretically. Each market participant values the good based on their appraisal of whether and how much other participants will value it. The origins of money serve as a good basis to understand this game-theoretic nature.
Through leveraging four fundamental technologies (peer-to-peer networks, digital signatures, distributed ledgers and proof-of-work consensus), Bitcoin enjoys the following qualities:
- Scarcity : Bitcoin has a fixed supply — it marked the discovery of absolute scarcity in a monetary good.
- Durability : Being digitally replicated throughout the world, Bitcoin cannot degrade.
- Portability : Bitcoin is transferable to anybody in the world like sending an email, WiFi connection or not. It can be stored in a flash drive or even as numbers in your head, allowing you to carry it wherever, undetected.
- Fungibility : Each bitcoin is equal , unlike real estate or diamonds, for example.
- Verifiability : It’s quick and easy to verify as authentic, unlike gold (See: “China’s biggest gold fraud, 4% of its reserves may be fake: Report”).
- Divisibility: A bitcoin can be split into one hundred-millionth of a single coin — 0.00000001 BTC (called a satoshi)
- Decentralization: No central authority can change anything about the protocol
- Censorship-resistance: Due to the decentralized nature of the network and portability of bitcoin, it is hard for any corporation or state to truly prevent the owner of the good from using it, although they can disincentivize them.
- User sovereignty: In a world of cashless payments, a person has decreasingly little sovereignty over their possessions. A bank account can be frozen at any time, a stock brokerage can go bust, bonds can default, gold in the bank can be confiscated. Bitcoin allows you to truly own what’s yours.
These qualities check almost all the marks for a perfect store of value.
Safe Haven
In a world where asset bubbles are inflating and money is being devalued at a record pace, Bitcoin is a glimmer of hope.
It is hard money — one that never inflates. At most, 21 million bitcoin will ever exist in circulation.
Further, Bitcoin is sound money:
Sound money — Money whose purchasing power is determined by markets, independent of governments and political parties. E.g., money backed by gold. (Note the Bretton Woods system did not qualify as sound money because the government had a fixed peg price for exchange).
It is truly borderless — a global monetary good accessible by all. It is a much-needed safe haven for third-world countries who cannot access reliable store of wealth, Bitcoin is finding use in said places.
In a world of negative real rates within developed markets, and a host of currency failures in emerging markets, what Bitcoin offers has utility.
In that way, it is a better store of wealth than gold.
Money
The root problem with conventional currency is that a lot of trust is required to make it work.
The central bank must be trusted not to debase the currency, but history is full of breaches of such trust.
Banks must be trusted to hold our money and transfer it electronically, but history is full of examples where they lend it out in waves of credit bubbles with barely a fraction in reserve and end up insolvent.
Most people in the West rarely give any thought to this, because it mostly works, barring the occasional meltdown. Unfortunately, a large portion of the world perpetually suffers from having to place trust in such institutions.
Many countries are plagued by inflationary regimes or politicized and untrustworthy banking systems. See Lebanon for a recent example, where the nationally-regulated Ponzi scheme erupted and its currency lost more than 50 percent of its purchasing power.
Bitcoin was specifically designed as a countermeasure to “expansionary monetary policies” by central bankers (aka, wealth confiscation via inflation).
This is why Bitcoin was released after the Great Recession and its genesis block in the blockchain says “The Times 03/Jan/2009 Chancellor on brink of second bailout for banks.”
More than just a new monetary technology, Bitcoin is an entirely new economic paradigm: an uncompromisable base money protocol for a global, digital, non-state economy. It promises to mark the separation of money and state.
Bitcoin presents us with an opportunity to reinvent gold and rethink money for the digital future in a more globalized, internet-native way.
Network Effect
One common criticism of Bitcoin is that it is not perfect technology. Some go as far as to call it legacy. Over the years, many competitor cryptocurrencies have been created with the goal of dethroning Bitcoin through better, shinier features and improvements (e.g., greater privacy, increased efficiency in transactions, “fairer” governance models).
Unfortunately for them, these competitors lack the massive network effect of Bitcoin — they are very unlikely to be able to catch up.
The network effect for Bitcoin is wide. It encompasses:
- The liquidity of its market (large investors will seek the most liquid market)
- The number of people who own it (otherwise who’s to say it’s valuable?)
- The community of developers maintaining and improving its software (critical, as we are talking about a software protocol)
- Brand awareness (self-reinforcing, as would-be competitors to Bitcoin are always mentioned in the context of and compared to Bitcoin itself)
The network effect also attracts miners who help make the chain more secure, which is also a self-reinforcing loop that grows the network effect.
Large investors, even nation-states, will seek the most secure market.
Theoretically, an alternative cryptocurrency with the same network effect could outcompete Bitcoin — the problem for them is that such network effect is likely not attainable again.
Undisruptable
The path-dependence in the invention of Bitcoin magnifies and underpins its network effect — it makes Bitcoin extremely hard to disrupt.
The launch, growth and organic adoption path of Bitcoin as a proof-of-work asset is non-repeatable. It’s trajectory was a sequence of idiosyncratic events that likely cannot ever be reproduced.
As Bitcoin opened the world’s eyes to digital scarce assets, any “New Bitcoin” attempting to launch today would face issues that Bitcoin did not — no miners/hash rate resulting in weak security early on (something attackers would take advantage of) and an even weaker incentive to attract investors.
Security is the number one requirement for any sound store of value system, after all.
Look no further than the “Bitcoin Cash” chain fork that proved to be a failure, only succeeding in being a real world example of the importance of Bitcoin’s path-dependent emergence.
Discovery of Absolute Scarcity
The invention of Bitcoin can be seen as a critical breakthrough — the one-time discovery of absolute scarcity — a totally unique monetary property never before achievable by mankind.
There is no other asset in the world that has absolute scarcity — gold is constantly mined, money is printed, stock certificates are issued, real estate is built, etc. The only other thing in the world that has absolute scarcity is time. In the same way that you cannot create more time, you cannot create more bitcoin.
Like the invention of zero, which led to the discovery of “nothing as something” in mathematics and other domains, Bitcoin is the catalyst of a worldwide paradigmatic phase change — the separation of money and state, as we mentioned earlier.
Strong Community
Bitcoin has a strong and vibrant community.
Back in 2017, it was popular to believe that most cryptocurrencies had good governance due to the possibility of exit — if the user base disagreed with the direction of the project, they could simply fork it and build it in their desired direction.
While this acts as good insurance against a project going completely sideways, it is in a project’s best interest to have a minimum amount of disputes that cause splits. Such hard forks only shrink the backers of the project.
Despite going through numerous hard forks and community dispute, the diehard believers and top-calibre talent have continued to support and build the digital asset according to the founding principles.
Bitcoin keeps its domain narrow — its users only need to believe in the idea of a sound, fast-settling global digital money system with finite supply.
By refusing to compromise on its key features, Bitcoin has remained the dominant cryptocurrency.
This rigidity of Bitcoin is a strength — it upholds a strong community, reduces protocol risk and maintains stable operations. It acts as a source of credibility, allowing people to feel safe allocating their savings in the technology for decades.
It is a great testament that the community has core values it will strongly defend. These people have a long-term vision and low time preference — they are planting seeds for the future.
The investor community is growing as well. Less than 1 percent of bitcoin held for more than one year was traded when the price fell so abruptly (more than 60 percent) this March. An ever-growing chunk of strong believers (HODLers) is forming, as shown in this chart.
Lastly, digital assets have no shortage of talent. A massive brain drain is occurring from Wall Street to the digital asset industry.
Bitcoin Volatility
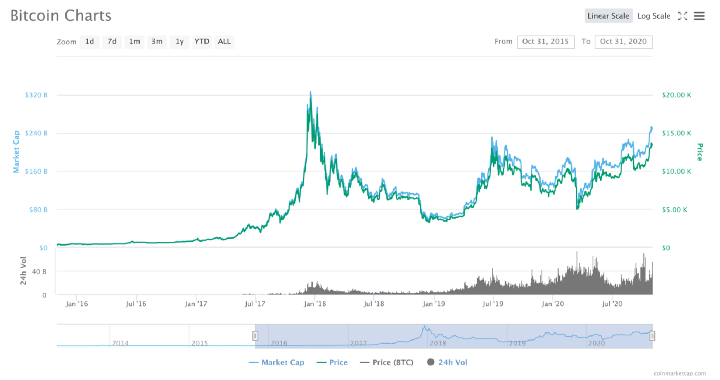
Bitcoin dropping and gaining 50 percent or more like it’s nothing. Source: coinmarketcap.com.
Bitcoin is an incredibly volatile asset. It has had incredible price swings, dropping close to 50 percent in two days last March during the liquidity crunch.
Said volatility is a function of its nascency — yet unproven, a relatively small market cap, speculators chasing quick profits and little volume all result in that.
When Bitcoin reaches a market cap similar to gold, which is around $11 trillion, and therefore a similar demographic adopting it, it is logical for it to adopt similar volatility as well. To reach such a market cap though, a lot of upwards volatility is required — and with it comes downside volatility.
Regardless, such large drops like the one in March can be thought of as a feature, not a bug. Unlike the stock market, Bitcoin does not have circuit breakers (two of which we saw during the liquidity crunch). Without such intervention, actual price discovery can occur and the weak hands (speculators) get shaken off.
Even though Bitcoin dropped a massive amount during that time, it quickly and steadily climbed back up, reaching new highs recently.
As of this writing, it is worth $17,500.
Price Potential
The potential of Bitcoin is too large to easily comprehend, especially in unprecedented times like these.
While Bitcoin can grow beyond the addressable market of money, we will keep exploring that narrative for the scope of this post.
The main functions of money are
- Store of Value (SoV) : to preserve wealth
- Medium of Exchange (MoE): to barter
- Unit of Account (UoA): to denote prices in it
No money starts by providing all three functions — each new species of money follows a distinct evolutionary path to acquire all three.
Note that the SoV phase has the best chance of happening and will likely see the steepest growth in price, but it is worth speculating what adoption as global money would look like too.
As we know that predicting prices in any specific time horizon is something even the most seasoned investors struggle with, we will abstain from it. Rather, we will focus on theoretical, long-term valuations.
Hundreds of Thousands — Store of Value Competitor
If we treat Bitcoin as a worthy competitor of gold, it has a lot of catching up to do.
Gold’s current market capitalization is estimated to be around $10 trillion and as of this writing, Bitcoin is only 2.5 percent of that.
Bitcoin is superior to gold in every way besides established history. It is logical to assume that as time passes and the Lindy effect takes hold, Bitcoin will continue eating up gold’s market share as a store of value.
If Bitcoin exists for 20 years, there will be near-universal confidence that it will be available forever, much as people believe the internet is a permanent feature of the modern world. Coincidentally, Bitcoin’s 12th birthday just passed!
We acknowledge that for Bitcoin to surpass gold’s market capitalization as a store of value, wealthy nation states will need to participate as well.
Regardless, it is enough to eat up 10 percent of gold’s cap ($1 trillion) in order to mark four-times growth as of today. Retail and institutional investors can easily prop up the price that much and we will later show that such adoption is growing at a promising rate.
Additionally, Bitcoin can also eat up some currencies that are used as a store of value. If we assume that Bitcoin has the chance to become the world’s global savings vehicle, it will eat up market share of the dollar, the Japanese yen and the Swiss franc since they are touted as safe haven assets.
In the context of 2020, gold’s $10 trillion market cap is likely to increase too.
After all, we have an overpriced stock market with overvalued risky bets and a $100 trillion bond market whose interest rates are decreasing and could go to negative yielding territory.
You need just 10 percent of the bond market money moving into BTC to move the needle and make it above gold.
Millions — Store-Of-Value Incumbent
For 1 bitcoin to be worth $1 million, its market cap needs to be about $18.5 trillion (given that there are 18.5 million bitcoin in circulation today)
If bitcoin were to cement itself as the ultimate store of value, this market capitalization seems quite achievable.
Real estate is similar to Bitcoin in two ways: it also possesses considerable scarcity and is also considered a good store-of-value venue for investment.
According to the latest ”Wealth Report” by Knight Frank, real estate is the largest asset allocation of the average ultra-high net-worth individual portfolio, accounting for 27 percent of portfolios.
 Source: “Wealth Report” by Knight Frank
As you can see, there are many pieces of the pie which Bitcoin can eat chunks off of. Here is Bitcoin’s market capitalization compared to other assets that are considered good stores of value:
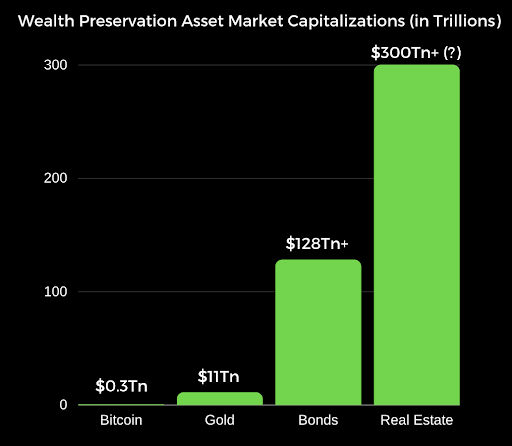
Source: Chart created by author
It’s worth noting that the real estate market is potentially much larger than $300 trillion — the latest data we could find estimated it at $280 trillion in 2017.
Plotted against these assets, a multiple-trillion-dollar bitcoin valuation does not seem insurmountable. Especially with all of the massive money printing in the world, what’s a few trillion between friends?
Increasing inflation and increased interest from investors seeking stores of value will offer Bitcoin tailwind to reach such astounding market caps faster.
As a non-sovereign monetary good, it is also possible that at some stage in the future bitcoin will become global money (much like gold during the classical gold standard of the 19th century).
Infinity
If Bitcoin in fact becomes global money and the whole world is using it, it makes sense to assume that it will only continue to gain in value as the world’s economy progresses. Deflation driven by technology, or newly-gained efficiency in producing materials/services, should make everything cheaper.
Because Bitcoin’s supply is fixed (absolute scarcity), we will essentially see the same service/product become cheaper over time.
For an oversimplified scenario, let’s compare the cost of gold and a brand new car in both 2010 and 2020:
- 2010: Gold at $1,226 average closing price. A new car: $29,217 average price (23.8 oz of gold)
- 2020 : Gold at $1,752 average closing price. A new car: $37,851 average price (21.6 oz of gold)
In a decade, gold increased by 42 percent and the price of a new car by 29.5 percent.
Measured in gold, you could say that new cars became 9.2 percent cheaper in the last decade.
Ignoring market dynamics, you could explain this by claiming car production got cheaper at a rate faster than the supply of gold.
Enough daydreaming! Let’s be practical and look at what is happening in the real world with Bitcoin right now.
The Market Is Waking Up

“burn bright.” by Jordan Wozniak on Unsplash
So far, 2020 has been a massive year for Bitcoin.
As with any other trend, COVID-19 accelerated digital asset adoption. This whole pandemic has brought a flurry of positive news for Bitcoin.
Many events in the space and outside it have made the case for Bitcoin many times stronger, whereas it can be argued that the price hasn’t caught up yet.
It seems like it is a matter of time until the asset truly takes off.
Let us go over all of the recent events that have made the Bitcoin bulls increasingly optimistic.
Entering The Mainstream
Bitcoin has seen a large amount of new exposure in the last few months. The world has steadily been opening up to the opportunity.
Bitcoin In Regulation
In July, the U.S. Office of the Comptroller of the Currency (OCC) passed a law that allowed banks to offer custody services for digital assets.
This was a massive milestone in the goal of broad cryptocurrency adoption, finally providing some regulatory certainty in Bitcoin banking.
Not too far after, in September, the state of Wyoming awarded the well-known exchange Kraken a license to create the first cryptocurrency bank in the U.S. — Kraken Financial.
Expected around Q1 2021, customers of Kraken could pay bills or receive salaries in cryptocurrency and hold cryptocurrencies with the bank. Future services could include crypto debit cards and staking.
Kraken won’t be the only cryptocurrency bank in the U.S. — it will have competition from Avanti, which was granted the same bank charter a month later.
By all accounts, it seems like cryptocurrencies are here to stay and that American citizens will be able to hold their digital assets in the same way they hold their dollars.
Bitcoin Investment In The Institutions
It is obvious that there is visible demand for regulated Bitcoin financial instruments, like an exchange-traded fund (ETF).
Some countries have realized this. Bermuda, in September, allowed the world‘s first Bitcoin ETF to launch in its stock exchange.
While the U.S. regulations (per the U.S. Securities and Exchange Commission [SEC]) are holding innovation back, interested investors still find a way.
High-Profile, High-Net-Worth Investors Publicly Investing In Bitcoin
Bitcoin has never before seen so much validation from renowned investors and firms in the public space. An onslaught of positive news has been coming in these past months.
Back in May, the famous billionaire hedge fund manager Paul Tudor Jones shared that his fund was investing a single-digit percentage into bitcoin as a hedge against inflation.
“It has happened globally with such speed that even a market veteran like myself was left speechless,” Jones wrote. “We are witnessing the Great Monetary Inflation — an unprecedented expansion of every form of money unlike anything the developed world has ever seen.”
“The best profit-maximizing strategy is to own the fastest horse. If I am forced to forecast, my bet is it will be Bitcoin.”
Paul Tudor Jones
He recently touted the asset again, citing the massive contingent of smart, sophisticated people in the community and comparing the investment to an early tech company like Apple or Amazon back in the days.
This sort of public adoption from a well-known and well-respected name is enough to open the eyes of many other hedge fund managers who may see the same qualities in the asset that Jones did.
But that didn’t seem enough. Most recently, we’ve had two other well-respected names in the investing space publicly share their interest in Bitcoin.
Billionaire Stanley Druckenmiller announced on national television that he is holding bitcoin and, while it’s admittedly less than his gold position, he is predicting that it will outperform gold.
Most recently, a CIO from Blackrock (the world’s largest investment management company with over $7.4 trillion under management in 2019) mentioned on national television that he believes Bitcoin is here to stay. He noted that it is likely to take the place of gold to a large extent.
Wall Street Legend Bill Miller was also bullish, saying “every major bank and high-net-worth firm is going to eventually have some exposure to Bitcoin or related assets (gold, commodities)”.
Other famous billionaires are also long Bitcoin — some examples include Mike Novogratz, Jack Dorsey and Chamath Palihapitiya.
The narrative is turning sharply. Many investment firms/banks are also making public statements or otherwise investing in the asset — see Citi predicting a $300,000 price by December 2021, Guggenheim reserving right to invest 10 percent in a Bitcoin trust, BTIG putting a $500,000 price target and AllianceBernstein admitting Bitcoin has a place in portfolios.
The promising thing is that, as more such institutions and respected people speak out, the likelier it is for additional institutions to take action because internal champions inside them are less likely to be dismissed and the career-risk (investing in an unestablished asset) for fund managers is reduced.
Grayscale
Grayscale is a company that offers public and private investment funds covering digital assets. Investors who are looking for Bitcoin exposure but do not want to have their own custody are turning to Grayscale to manage their assets.
They are in an unique position because they currently have the largest viable physical bitcoin product that fits into the legacy financial system — reasonably so, companies like Fidelity are trying to catch up.
Grayscale issues quarterly reports regarding the assets it manages and said reports are showing massive growth in the amount of Bitcoin investments its fund is receiving.
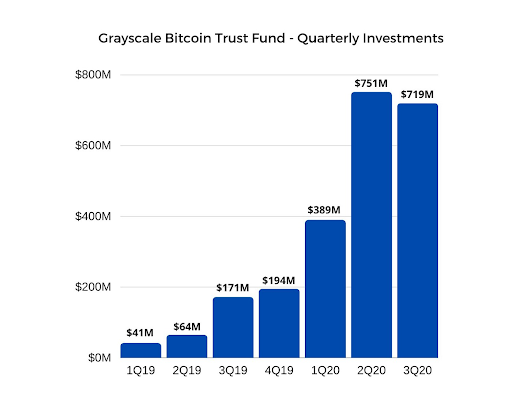 Source: Chart created by author
- Q1 2019 : $41 million invested into their Grayscale Bitcoin Trust ($GBTC)
- Q2 2019 : $64 million
- Q3 2019: $171 million (300 percent quarter-over-quarter growth)
- Q4 2019: $194 million
It had reportedly raised $608 million (in BTC and other asset investments) in 2019, surpassing the cumulative investment from 2013 to 2019 combined.
2020 is truly going to be its best year yet.
- Q1 2020: $389 million (224 percent quarter-over-quarter; 1,177 percent year-over-year growth)
- Q2 2020: $751 million (180 percent quarter-over-quarter growth)
- Q3 2020 : $718 million (this is its fourth record-breaking quarter in a row)
Year-to-date investment into Grayscale has been over $2.4 billion (counting other assets like ether) — more than double its $1.2 billion cumulative inflow from 2013 to 2019.
Grayscale has consistently reported that interest in its funds are coming primarily (84 percent-plus) from institutions, most of them being hedge funds.
Estimates say that Grayscale is buying bitcoin at a rate of 150 percent the amount being mined daily. In other words, Grayscale is likely eating up all of the new supply in bitcoin and then some.
As of this writing, it holds over $9.1 billion in assets under management.
Most interestingly, JPMorgan has said that investors appear to prefer bitcoin over gold, with gold ETFs seeing modest outflows in October whereas bitcoin funds have increasing inflows.
Bitcoin Investment In The Corporate Balance Sheet
MicroStrategy was the first public company to invest in bitcoin as a way to diversify its corporate balance sheet. It invested a whopping $250 million into bitcoin, buying 21,454 BTC in August 2020.
This is a significant investment — MicroStrategy, an established public company, invested close to 25 percent of its total assets in BTC as a way to protect against currency debasement. Not only that, it invested some $175 million extra after that in September.
“Those macro factors include, among other things, the economic and public health crisis precipitated by COVID-19, unprecedented government financial stimulus measures including quantitative easing adopted around the world, and global political and economic uncertainty,” CEO and Founder Michael Saylor has said. “We believe that, together, these and other factors may well have a significant depreciating effect on the long-term real value of fiat currencies and many other conventional asset types, including many of the assets traditionally held as part of corporate treasury operations.”
“We really felt we were on a $500M melting ice cube. Once the real yield on our treasury got to more than negative 10%, we realized that everything we are doing on P&L is irrelevant.”
Michael Saylor
Saylor has been very vocal about Bitcoin and the problems it fixes ever since. Who can blame him — as of this writing, MicroStrategy has gained 44 percent ($187 million) from its investment.
A funny point is that not many companies can match MicroStrategy’s initial investment of 21,500 BTC. In fact, only 0.10 percent of all public companies (862) in the world can afford to do the same before the supply of bitcoin literally runs out. If 862 companies bought 21,500 BTC, they would collectively have about 18.5 million BTC, which is the current supply in circulation.
More importantly, MicroStrategy took the first step and, like Roger Bannister and the four-minute mile, has shown the world that it is reasonable to diversify your corporate balance sheet away from fiat money.
Many companies have been building up their balance sheets prior to COVID-19 in expectations of a recession. Once these companies with extra cash on their balance sheets see the benefits, they are likely to begin following suit.
In fact, not long after we saw Square, whose CEO Jack Dorsey is a firm believer in Bitcoin, invest $50 million or 1 percent (admittedly, a small portion) of its total assets into bitcoin as well. Square also published a white paper that thoroughly explained how it bought and took custody of the large amounts of bitcoin in a secure way, that any other public company can replicate.
It is only a matter of time until we see more companies come out with announcements on how much they’ve bought. Here are the balance sheets of three crypto-friendly companies as of their Q3 earnings reports:
- Square: $2 billion (just $50 million invested in BTC)
- Twitter: $7.7 billion
- PayPal : $16.2 billion
Whatever happens, it is a fact that companies are steadily accumulating more and more BTC in their balance sheets. See https://bitcointreasuries.org or https://www.kevinrooke.com/bitcoin for an up-to-date snapshot of how much is publicly held by companies.
Bitcoin In Apps
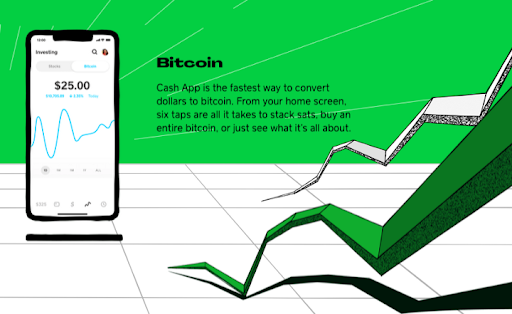 Square’s Cash App Bitcoin investment advert. Source: http://cash.app.
Bitcoin adoption has also been taking off through the many intuitive, easy-to-use apps that allow for bitcoin purchases. Some examples are Coinbase, Robinhood, Revolut and Square’s Cash App.
Square is the only public company of the above for which we can take a look at the numbers. Cash App has been selling bitcoin for almost two and a half years now (since Q2 2018). Its sales in bitcoin have been growing at a rapid pace recently.
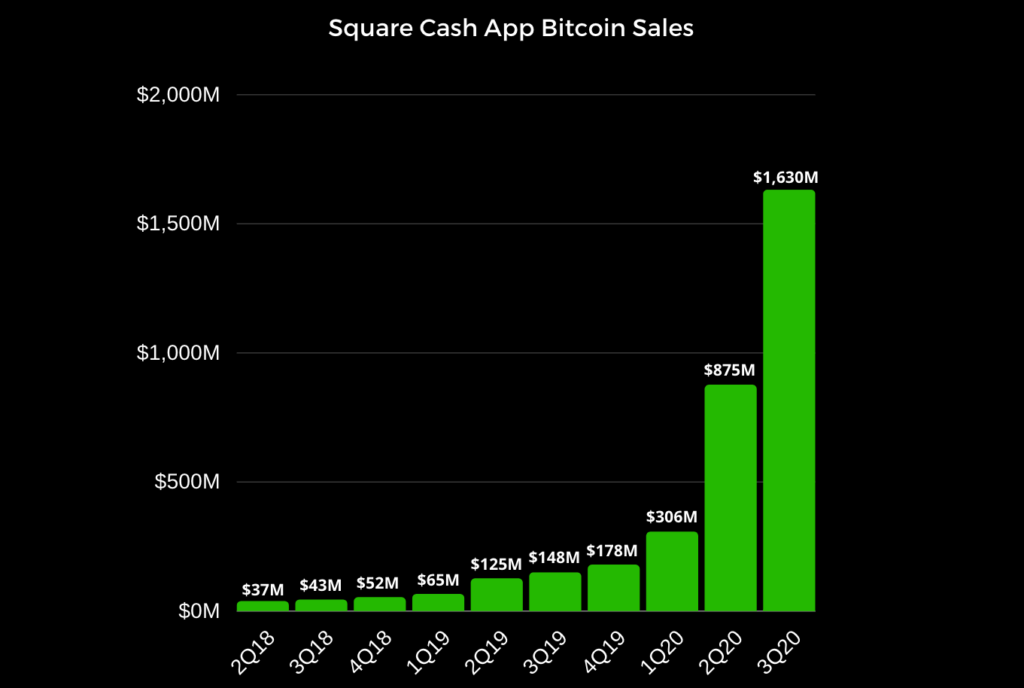 Source: Chart created by author
The recent percentage growth is beyond spectacular, especially when accounting for the amount of volume in sales.
- Q1 2020: $306,000 (up 470 percent year-over-year)
- Q2 2020: $875,000 (up 700 percent year-over-year)
- Q3 2020: $1.6 million (up 1,100 percent year-over-year)
Venmo, owned by PayPal, is the biggest competitor to Cash App.
It has apparently noticed, given that in October PayPal announced and recently released a feature allowing users to buy and hold bitcoin in their PayPal digital wallet. There is already speculation that it has brought a good amount of volume to the industry.
Starting in the U.S., PayPal plans to expand this feature to select international markets in the first half of 2021 and also port it to Venmo.
It will additionally provide educational content for its user base.
It is great news to see that PayPal will eventually expose its 340 million user base to Bitcoin — another decision that will ultimately drive crypto to mainstream adoption.
Fundamentals Strengthening
While Bitcoin has been rapidly gaining exposure throughout the pandemic, it has also been strengthening itself.
Bitcoin Halving
Starting from inception in January 2009, about 50 new bitcoin were produced every 10 minutes from miners verifying a new block of transactions on the network, called the block reward.
Bitcoin’s deflationary nature comes from the fact that it’s programmed to decrease this block subsidy — an event called a halving.
Bitcoin has so far gone through three halvings, the latest of which occurred in May 2020, halving the block reward from 12.5 BTC to 6.25 BTC.
This causes a supply shock which has historically driven a bull market and a mania over the asset in the ensuing 18 months (as of writing, we are in month five). The mechanics are clearly described here.
This process greatly increases the stock-to-flow (S2F) ratio of Bitcoin.
Stock-to-flow ratio — The stock of a certain commodity compared to the rate of production. e.g estimates say gold has 200,000 tons above ground and 3,000 tons of annual new supply, putting its stock-to-flow ratio around 66
Today, this is in the upper fifties for bitcoin and it is projected to go over 100, surpassing gold’s S2F ration after Bitcoin’s fourth halving in 2024.
People modeling Bitcoin after this stock-to-flow ratio are predicting prices ranging between $55,000 to $288,000 per coin (respectively, a $1 trillion to $5.5 trillion market cap), a model that has since held up.
Price Action
Nothing else guarantees the market waking up like some solid price action, cryptocurrency-style. As of starting this piece, the bitcoin price had rallied 70 percent upwards.
 Source: https://www.coindesk.com/price/bitcoin
Bitcoin is setting records each day for its longest number of consecutive days spent over $10,000. It also recently beat its past all-time high record in both market cap (the previous figure was $334 billion) and in nominal coin price (the previous record was $19,783).
As we will discuss next, price action has a strong positive correlation with network security. The more the price rises, the more interest from miners and the more secure the network becomes. This, in turn, can attract more investors.
Despite the massive gain, the market cap of Bitcoin is still small compared to its potential. We expect further large gains in the long term.
Stronger Security
Bitcoin’s security is tied to its hash rate — the measuring unit of the processing power of the Bitcoin network.
There is a strong network effect in Bitcoin that helps securitize the network:
- The price of bitcoin rises
- Mining becomes more profitable due to the increased price of bitcoin received from the mining reward for producing the next block
- More miners join the network to compete for this increased reward and, in the process, contribute their electrical power — the hash rate goes up
- Network security follows the hash rate’s growth as the increased amount of electricity spent creating blocks means more electricity is required for an attacker to override the previous blocks
- With more network security comes more trust in the network’s ability to preserve the coins of the holders, leading to an increase in adoption
- The cycle repeats as these new users, as well as increased trust in the network, lead to an increase in the overall use and subsequent price of the asset
Bitcoin’s hash rate is over seven-times larger than it was during the peak of its historic price climb to an all-time high in late 2017. We’re seeing resources being spent researching, developing and deploying mining hardware at a record pace.
Negative Network Effects
The Bitcoin ecosystem was long plagued by security vulnerabilities in external services, price volatility and a steep learning curve.
All of which has resulted in massive negative media coverage — Bitcoin has been announced “dead” at least 383 times as of this writing.
It’s fair to assume that the price has been affected by these factors, but it is only a matter of time until these issues are cleared up.
Conclusion — Bitcoin Investment
Bitcoin’s strengthening fundamentals paired with the recent world trends make investment in the asset a very attractive investment opportunity , one that is perhaps once in a lifetime.
It is the original, longest-lasting cryptocurrency with the highest levels of hash power, network effects, liquidity, market capitalization and the strongest community.
Bitcoin is the first truly global bubble whose size and scope is limited only by the desire of the world’s citizenry to protect their savings from the vagaries of government economic mismanagement.
After all, Bitcoin rose like a phoenix from the ashes of the 2008 global financial crisis, a crisis that was largely caused by mismanaged bank policies.
In a time where the whole system appears messed up, Bitcoin provides the average person with a solid way to “opt out,” hedging against all system risk and preserving their value in the purest way.
The recent months have greatly increased Bitcoin’s chances of success, with all of the following:
- A deadly virus whose second wave is just unfolding
- Political instability and civil unrest
- Record amount of unemployment and business closures
- Conventional assets being in an unattractive phase, seemingly not accounting for the extra risk — projected slow growth, companies and individuals overburdened with debt, stocks valued at high earning multiples
- Unprecedented monetary politics and historical money supply expansion — high chance of inflation
- Negative interest rates looming around the corner
- Billionaires, institutions and corporate treasuries piling in on BTC
- Mainstream BTC adoption unfolding (Cash App, PayPal)
- BTC fundamentals the strongest they’ve ever been (hash rate, supply, community)
2020 has massively amplified the case for Bitcoin.
While Bitcoin’s price has jumped sharply in the past weeks while writing this article, it is still early.
There still exists a small window of opportunity in which normal investors can benefit from the upcoming avalanche of money into the space.
The question comes down to this: Do you think that this asset’s value is accurately priced at about a $325 billion market with all the facts presented here, keeping in mind that it was at a $200 billion market cap before any of this happened?
Personally, I’m irrationally long. With the direction that the world is headed in, it seems as if there is a lot more room to grow.
It is only a matter of time until more of the world opens its eyes to the opportunity and more capital enters the bitcoin market, only a matter of time until regulations get further relaxed and a Bitcoin ETF gets launched in a developed economy.
We are in for a massive upwards spiral driven by hype and fear of missing out on the scarcity of BTC.
The decentralized and bottoms-up nature of Bitcoin is truly beautiful.
What is happening can be described as a retail revolution that is driven from the ground up — one where the normal retail investor can front-run institutions, get ahead of pension plans, family offices, bankers and corporate treasurers.
Owning bitcoin is one of the few asymmetric bets that people across the entire world can participate in. Much like a call option, an investor’s downside is limited to one x, while their potential upside is still 100 x or more.


